High RollerINVESTMENTS
HIGH ROLLER INVESTMENTS LLC · COCOA BEACH, FLORIDA FY 2025 TOTAL ASSETS $10,029,332.68 OWNER’S EQUITY $9,753,354.66 NET OPERATING INCOME $490,517.37
FUNDS / RISK FUND · STATEMENT OF HOLDINGS
HIGH ROLLER INVESTMENTS · COCOA BEACH · FLORIDA ·
High Roller Investments LLC · Statement of holdings

Risk Fund

My current growth portfolio (3x leveraged), with comparisons to the underlying indexes.

HIGH-RISK SELECTIONS · PROCEED WITH CAUTION
Fund codePlaceholder code
Issued / as ofPlaceholder date
Positions08
Leverage3x
Current value$873,698.27
Total gain / loss+$583,627.78
Cost basis$290,070.49
§ 02

The portfolio, made visible.

Tiles sized by current value
SOXL
DIREXION DAILY SEMICONDUCTOR BULL 3X SHARES
$485,690.21
55.6%
TQQQ
PROSHARES ULTRAPRO QQQ
$140,089.19
16.0%
UPRO
PROSHARES ULTRAPRO S&P500
$76,462.37
8.8%
TECL
DIREXION DAILY TECHNOLOGY BULL 3X SHARES ETF
$68,334.28
7.8%
UDOW
PROSHARES ULTRAPRO DOW30
$50,857.26
5.8%
MVV
2.6%
CURE
2.0%
TMF
1.3%
SOXL
DIREXION DAILY SEMICONDUCTOR BULL 3X SHARES
$485,690.21
55.6%
TQQQ
PROSHARES ULTRAPRO QQQ
$140,089.19
16.0%
UPRO
PROSHARES ULTRAPRO S&P500
$76,462.37
8.8%
TECL
DIREXION DAILY TECHNOLOGY BULL 3X SHARES ETF
$68,334.28
7.8%
UDOW
PROSHARES ULTRAPRO DOW30
$50,857.26
5.8%
MVV
PROSHARES ULTRA MIDCAP400
$22,983.15
2.6%
CURE
DRX DLY HEALTHCARE BULL 3X
$17,513.83
2.0%
TMF
DIREXION SHS ETF TR DAILY 20+ YEAR T
$11,767.98
1.3%

Each share is that holding divided by the holdings-table total, $873,698.27.

§ 03

Ledger.

8 positions · USD
Transcribed from the published holdings image. Totals match the sum of the rows.
Ln.SymbolDescriptionQuantityCurrent valueTotal gain/lossCost basisAvg cost
01 SOXL DIREXION DAILY SEMICONDUCTOR BULL 3X SHARES 9,002.599 $485,690.21 +$394,288.45 $91,401.76 $10.15
02 TQQQ PROSHARES ULTRAPRO QQQ 2,512.36 $140,089.19 +$77,367.27 $62,721.92 $24.97
03 UPRO PROSHARES ULTRAPRO S&P500 628.544 $76,462.37 +$37,397.66 $39,064.71 $62.15
04 TECL DIREXION DAILY TECHNOLOGY BULL 3X SHARES ETF 558.241 $68,334.28 +$39,049.06 $29,285.22 $52.46
05 UDOW PROSHARES ULTRAPRO DOW30 807.002 $50,857.26 +$21,060.91 $29,796.35 $36.92
06 MVV PROSHARES ULTRA MIDCAP400 301.458 $22,983.15 +$6,476.20 $16,506.95 $54.76
07 CURE DRX DLY HEALTHCARE BULL 3X 150.385 $17,513.83 +$7,018.92 $10,494.91 $69.79
08 TMF DIREXION SHS ETF TR DAILY 20+ YEAR T 308.547 $11,767.98 +$969.31 $10,798.67 $35.00
TOTAL $873,698.27 +$583,627.78 $290,070.49
SOXL$485,690.21
DIREXION DAILY SEMICONDUCTOR BULL 3X SHARES
Gain/loss
+$394,288.45
Quantity
9,002.599
Cost basis
$91,401.76
Avg cost
$10.15
TQQQ$140,089.19
PROSHARES ULTRAPRO QQQ
Gain/loss
+$77,367.27
Quantity
2,512.36
Cost basis
$62,721.92
Avg cost
$24.97
UPRO$76,462.37
PROSHARES ULTRAPRO S&P500
Gain/loss
+$37,397.66
Quantity
628.544
Cost basis
$39,064.71
Avg cost
$62.15
TECL$68,334.28
DIREXION DAILY TECHNOLOGY BULL 3X SHARES ETF
Gain/loss
+$39,049.06
Quantity
558.241
Cost basis
$29,285.22
Avg cost
$52.46
UDOW$50,857.26
PROSHARES ULTRAPRO DOW30
Gain/loss
+$21,060.91
Quantity
807.002
Cost basis
$29,796.35
Avg cost
$36.92
MVV$22,983.15
PROSHARES ULTRA MIDCAP400
Gain/loss
+$6,476.20
Quantity
301.458
Cost basis
$16,506.95
Avg cost
$54.76
CURE$17,513.83
DRX DLY HEALTHCARE BULL 3X
Gain/loss
+$7,018.92
Quantity
150.385
Cost basis
$10,494.91
Avg cost
$69.79
TMF$11,767.98
DIREXION SHS ETF TR DAILY 20+ YEAR T
Gain/loss
+$969.31
Quantity
308.547
Cost basis
$10,798.67
Avg cost
$35.00
Total value$873,698.27
Gain/loss+$583,627.78
Cost basis$290,070.49
§ 04

The runway to the goal.

Computed from the printed totals
Invested dollars, printed on the analytic$289,980.84
Current value, holdings-table total$873,698.27
Gain from invested to current, computed+$583,717.43
To reach the printed all-time-high value, computed$104,028.15
Goal: value at all-time highs, printed$977,726.42

Positions are invested dollars and the holdings-table current value, each divided by the printed all-time-high value of $977,726.42. The analytic image prints current value $873,698.31, gain +$583,717.47, and $104,028.11 still to reach that goal. Those are a different snapshot from the holdings total.

Not retyped Per-holding all-time-high bars are not drawn. The source spreadsheet is too small to read every cell. It is shown below as published.
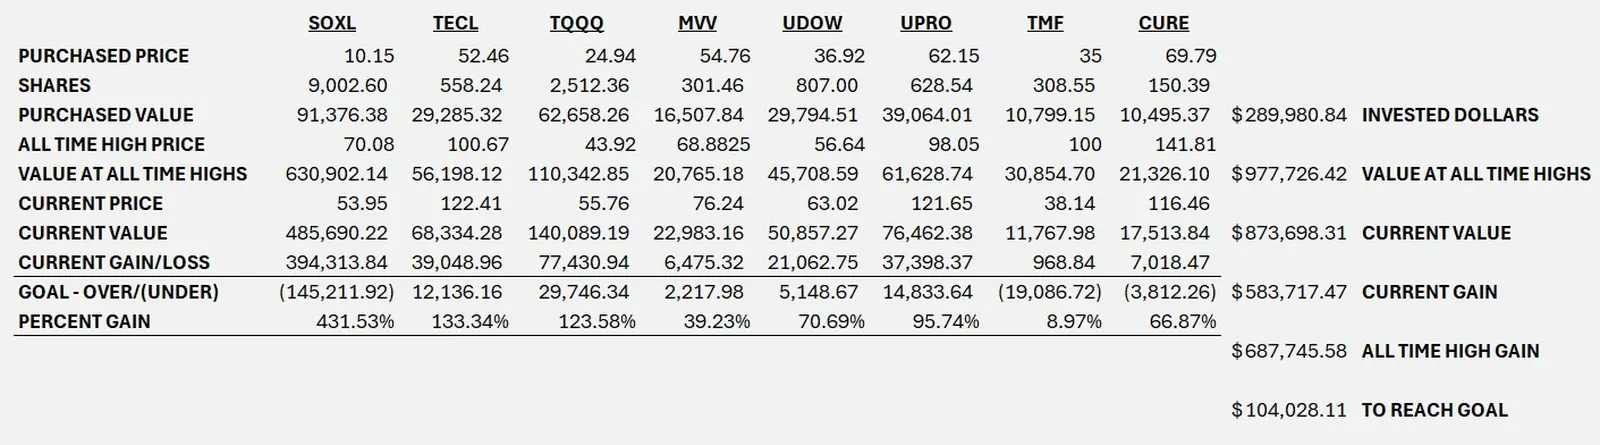
Projection spreadsheet for the risk-fund holdings.
§ 05

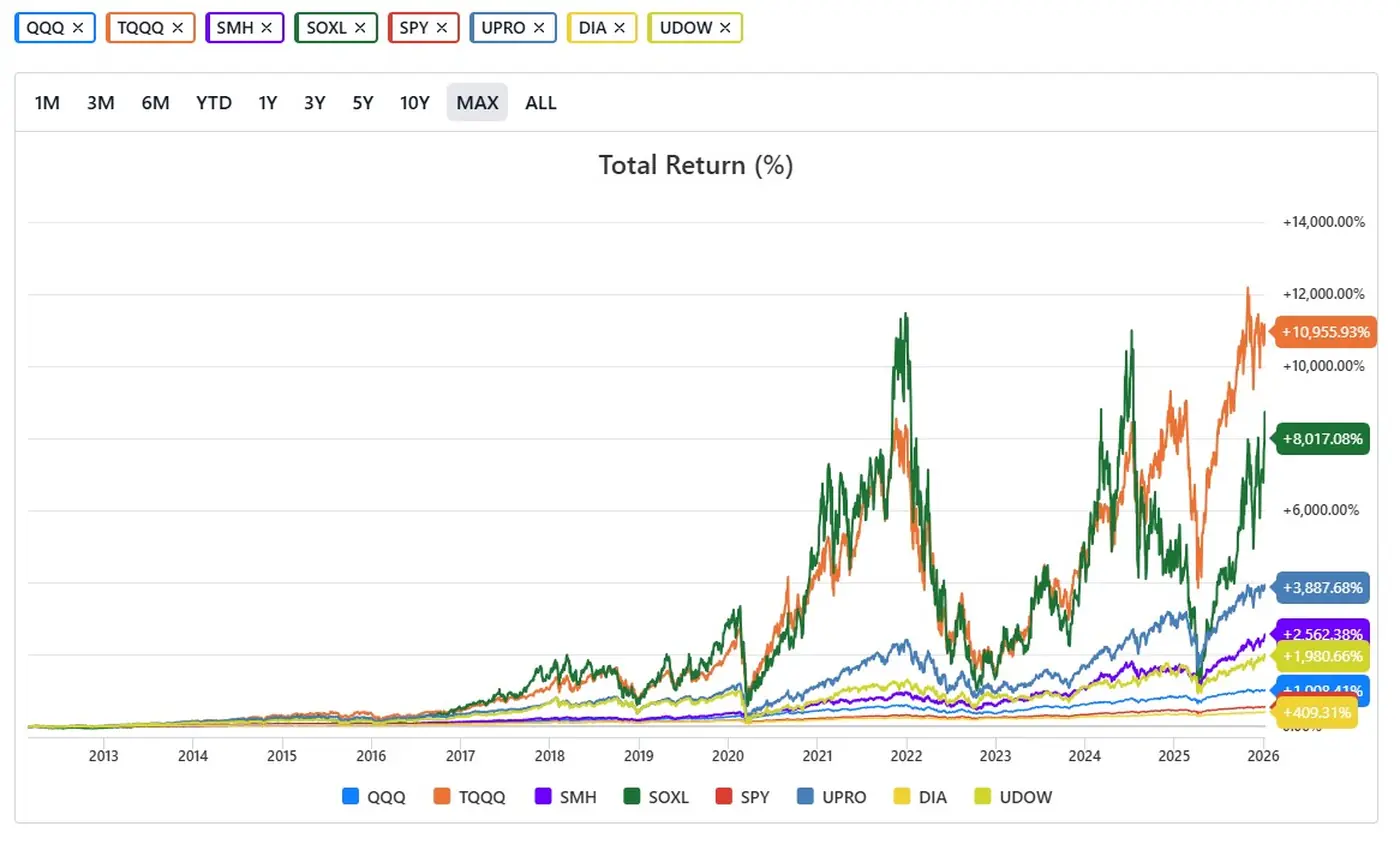
Total return vs. underlying indexes.

Total return chart comparing QQQ, TQQQ, SMH, SOXL, SPY, UPRO, DIA, and UDOW.
QQQTQQQSMHSOXLSPYUPRODIAUDOW